There's poverty everywhere ...
We've spent a fair bit of time talking about various methods to study poverty and development in this blog, ranging from plain vanilla surveys to financial diaries, RCTs and portfolio analytics, and it has all been within the context of developing countries. It is a reality that poverty exists in the developed world too, including the most vibrant economy in the world, the US. This post will talk about the US Financial Diaries program.
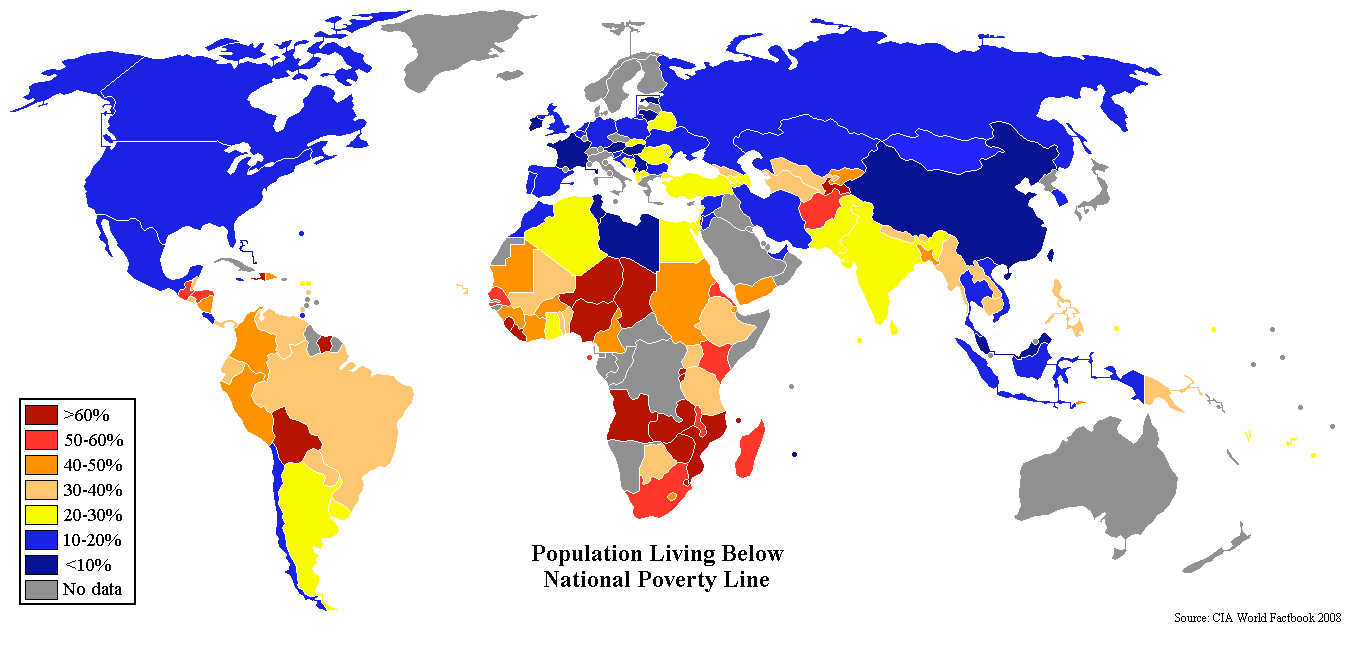
Just to put things in context, here's a map of the world showing poverty percentages compared to the national poverty line:
... including the US
This tells us between 10% and 20% of the population live below the poverty line in the US. The Oracle provides us with some more detail:
Poverty is a state of privation or lack of the usual or socially acceptable amount of money or material possessions. According to the U.S. Census Bureau data released Tuesday September 13, 2011, the nation's poverty rate rose to 15.1% (46.2 million) in 2010, up from 14.3% (approximately 43.6 million) in 2009 and to its highest level since 1993. In 2008, 13.2% (39.8 million) Americans lived in relative poverty. In 2000, the poverty rate for individuals was 12.2% and for families was 9.3%. In November 2012 the U.S. Census Bureau said more than 16% of the population was impoverished, and almost 20% of American children live in poverty.
And details can be found in all its glory right from the horses mouth; some of the highlights are copy/pasta-ed below:
- In 2011, the family poverty rate and the number of families in poverty were 11.8 percent and 9.5 million, respectively, both not statistically different from the 2010 estimates.
- As defined by the Office of Management and Budget and updated for inflation using the Consumer Price Index, the weighted average poverty threshold for a family of four in 2011 was $23,021.
- The poverty rate for males decreased between 2010 and 2011, from 14.0 percent to 13.6 percent, while the poverty rate for females was 16.3 percent, not statistically different from the 2010 estimate.
- In spring 2012, 9.7 million young adults age 25-34 (23.6 percent) were additional adults in someone else's household. The number and percentage were both unchanged from 2011.
- In 2011, 13.7 percent of people 18 to 64 (26.5 million) were in poverty compared with 8.7 percent of people 65 and older (3.6 million) and 21.9 percent of children under 18 (16.1 million).
- The South was the only region to show changes in both the poverty rate and the number in poverty. The poverty rate fell from 16.8 percent to 16.0 percent, while the number in poverty fell from 19.1 million to 18.4 million. In 2011, the poverty rates and the number in poverty for the Northeast, Midwest and the West were not statistically different from 2010. The poverty rate in the South was not statistically different from the rate in the West. In addition, the Northeast poverty rate was not statistically different from the rate in the Midwest.
More than one in eight individuals living in poverty is bad, right, given the relative abundance of wealth in the US? Consider the fact that 16 million (22%) of all children live in poverty - a number exacerbated along ethnic lines (38% of Black and 35% of Hispanic communities) and one can see how this is an important issue to address in the US. [Source for numbers.]
Enter the US Financial Diaries
There's been much renewed interest in the lives of the poor since financial armageddon a few years ago. Michael Barr's No Slack: The Financial Lives of Low-Income Americans is a recent publication that based on 1,000 in-depth surveys that elaborate various ways in which the financial system "fails the most vulnerable Americans". The U.S. Financial Diaries project is driven by similar motivations - it wants to understand how low-income individuals and households manage their financial lives.
You're probably familiar with the financial diaries methodology championed by PoTP - conducting repeated surveys exploring every detail of a HH's financial life for an extended period of time. This provides unprecedented detail, specially into behaviors that are difficult to pick out in one-off surveys, such as extent of engagement with the informal sector, and savings intermediation habits. As one can imagine, the presence or absence of various financial instruments creates a completely different ecosystem than say what we see in Kenya or India or the Philippines.
Non-probability sampling techniques are used, so the results will not be representative of the entire US. "Sites have been chosen to ensure geographic, ethnic, and racial diversity of households and urban/rural communities," according to the project website, with sites including "Cincinnati and surrounding areas, Northern Kentucky, Eastern Mississippi, San Jose and surrounding areas, Queens, and Brooklyn".
The project is in the data gathering stage right now, and we can expect analysis to start coming out in 2013 itself. It's got the heavyweights in this field behind it - it is being administered by New York University’s Financial Access Initiative (FAI), Bankable Frontier Associates (BFA) and The Center for Financial Services Innovation (CFSI), with funding from Ford Foundation
and Citi Foundation and the Omidyar Network.
I for one can't wait to see what comes out of it - the chance to compare and contrast with similar studies around with world will be quite interesting, as will be any follow up work that utilizes this information to design interventions to address the poverty situation in the US.


